2 - Inside simulator
2.1 - Number of access per image Ai
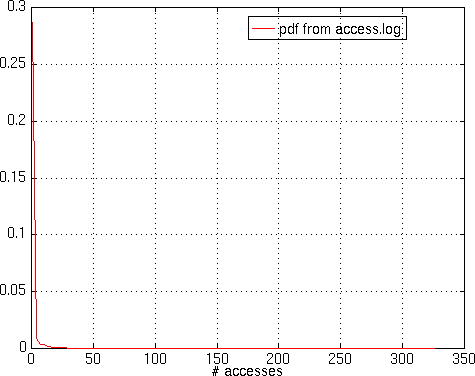
This is a built-in random variable, whose model has
been chosen by studying access logs during a fixed
period (24 hours). Figure 5 shows,
or doesn't show, the distribution of this variable,
figure 6 shows the model that has
been chosen, a negative exponential.
 |
|
Figure 5 - Observed distribution of Ai
|
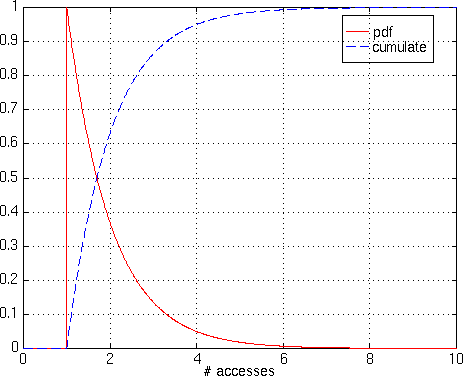
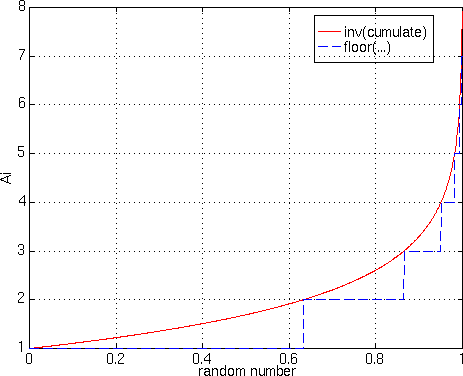
2.2 - Generation of random numbers
In the simulation there are two types of random
variables: negative exponential for Ai, and gaussian
for bandwidths and image size.
Figure 6 shows the distribution
of Ai and the cumulative function, figure 7
shows the inverse cumulative function, used for generating the
exponential random variable from a linear random variable.
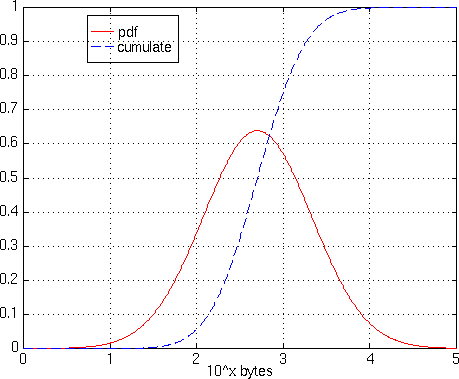
Figure 8 reports the modelized
distribution of Ri (as an example of gaussian distribution),
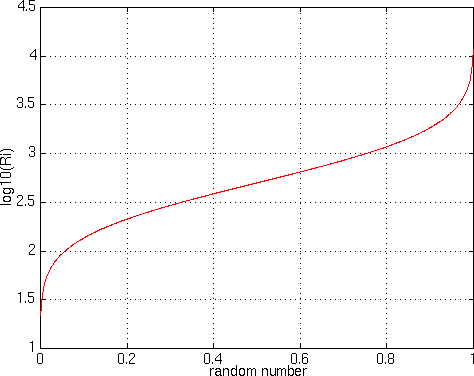
figure 9 shows the inverse cumulate
probablity function, theoretically used for generating gaussian
random variables from linear random variables. In the actual
implementation of the simulator a more efficient algorithm
is used.
 |
|
Figure 6 - Modelized Distribution of Ai
|
 |
|
Figure 7 - Ai random generator
|
 |
|
Figure 8 - Modelized Distribution of Ri
|
 |
|
Figure 9 - Ri random generator
|
3 - Results
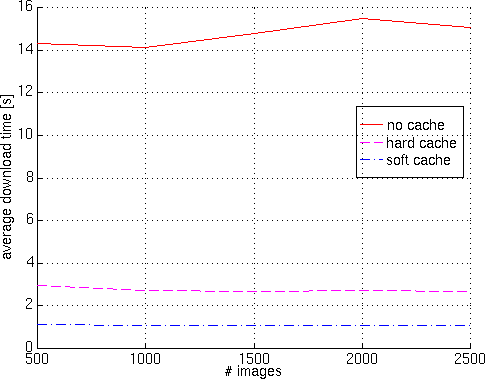
In table 2 there are the input parameters'
values for two runs of the simulator.
The first run aims to show that if the ratio between number
of images and cache size is constant, results are not dependent
on these two parameters, thus the number of images can be
kept small in order to make faster simulations.
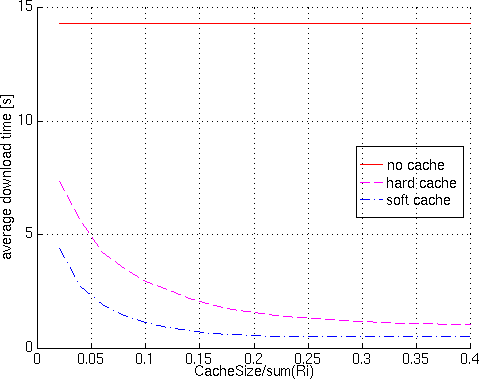
Run #2 tests the cache whith different load sizes, it starts
with cache size as big as 2% of total images size, and goes to
cache size equal to 40% of total images size.
Results of run #2 are shown in figure 11
through figure 13.
It can be seen that download time (figure 11)
keep decreasing as the cache becomes bigger, both for soft and hard
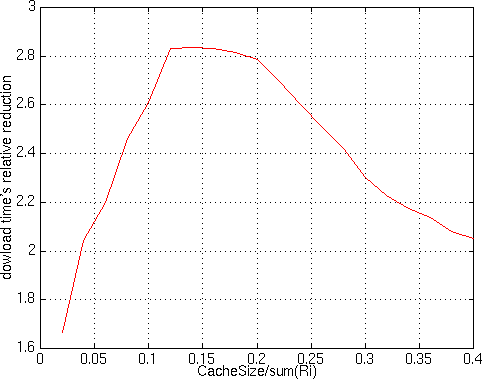
caching policies, but figure 12 shows that
the relative gain of soft cache w.r.t. hard cache has a maximum
at about 15% (cache size = 15% of total images size).
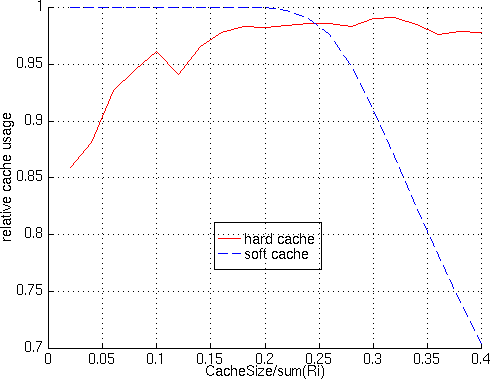
In addition, it can be seen from figure 13
that the algorithm implemented finds an optimal cache usage
for soft cache policy until cache size reachs 20%, then cache
usage for soft cache drops and at about 25% hard cache becomes
the better policy in terms of cache usage.
| Parameter |
Run #1 |
Run #2 |
| mu bc |
10^5.202 bit/s |
10^5.202 bit/s |
| sigma2 bc |
0.602 |
0.602 |
| mu bs |
10^4.12 bit/s |
10^4.12 bit/s |
| sigma2 bs |
0.6768 |
0.6768 |
| mu R |
10^3.041 byte |
10^3.041 byte |
| sigma2 R |
0.4736 |
0.4736 |
| m |
4 |
4 |
| d |
1 |
1 |
| I |
500 - 2500 |
500 |
| CS |
50 - 250 KByte |
10 - 200 KByte |
| t |
40 |
40 |
|
Table 2 - Input parameters' values
|
 |
|
Figure 10 - Results of run #1, download time
|
 |
|
Figure 11 - Results of run #2, download time
|
 |
|
Figure 12 - Results of run #2, relative reduction in
download time
|
 |
|
Figure 13 - Results of run #2, relative cache usage
|


